Visualization
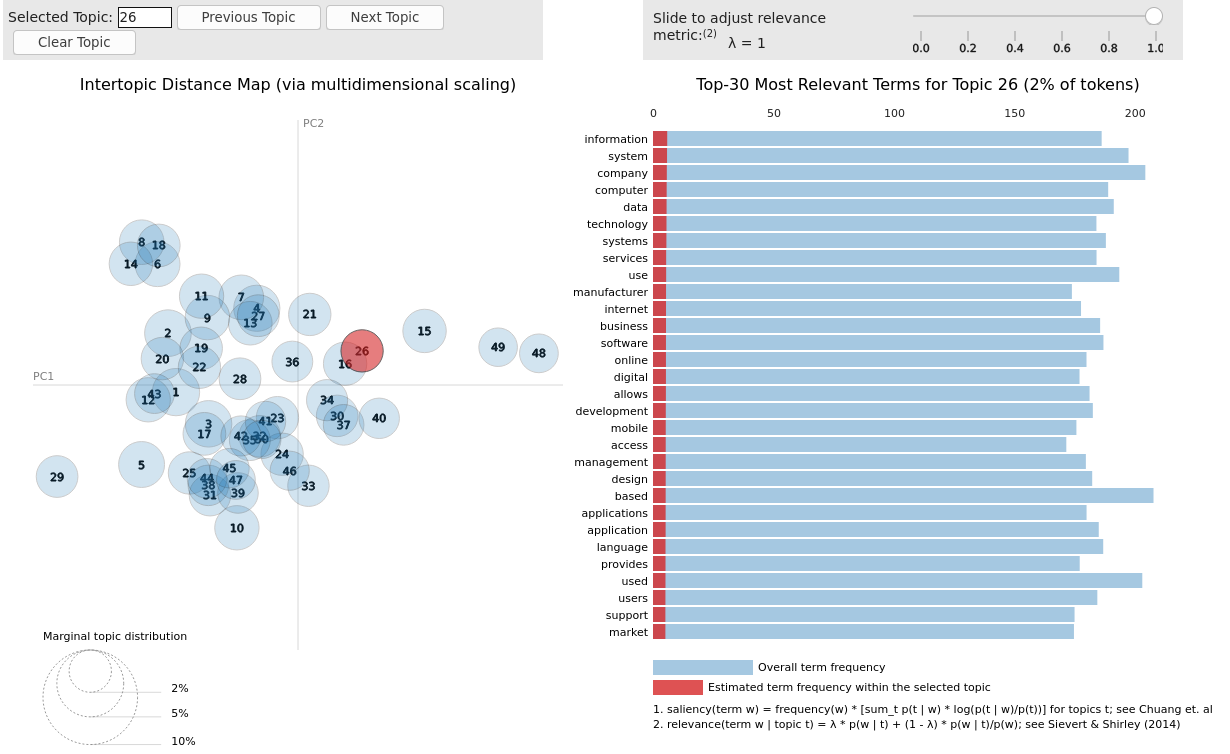
We offer two main plots to show your topics. The first one is based on PyLDAvis, a great package to analyze how your topic model is behaving. You can take a look to the PyLDAvis Github Page to get a better idea on how to interpret the different components.
The second visualization is a very simple topic visualization with a wordcloud.
PyLdaVis Visualization
If you already know how to use that, you’ll see that using PyLDAvis is very simple. First of all you need to install pyldavis.
We support pyLDA visualizations with few lines of code!
import pyLDAvis as vis

lda_vis_data = ctm.get_ldavis_data_format(tp.vocab, training_dataset, n_samples=10)

ctm_pd = vis.prepare(**lda_vis_data)
vis.display(ctm_pd)
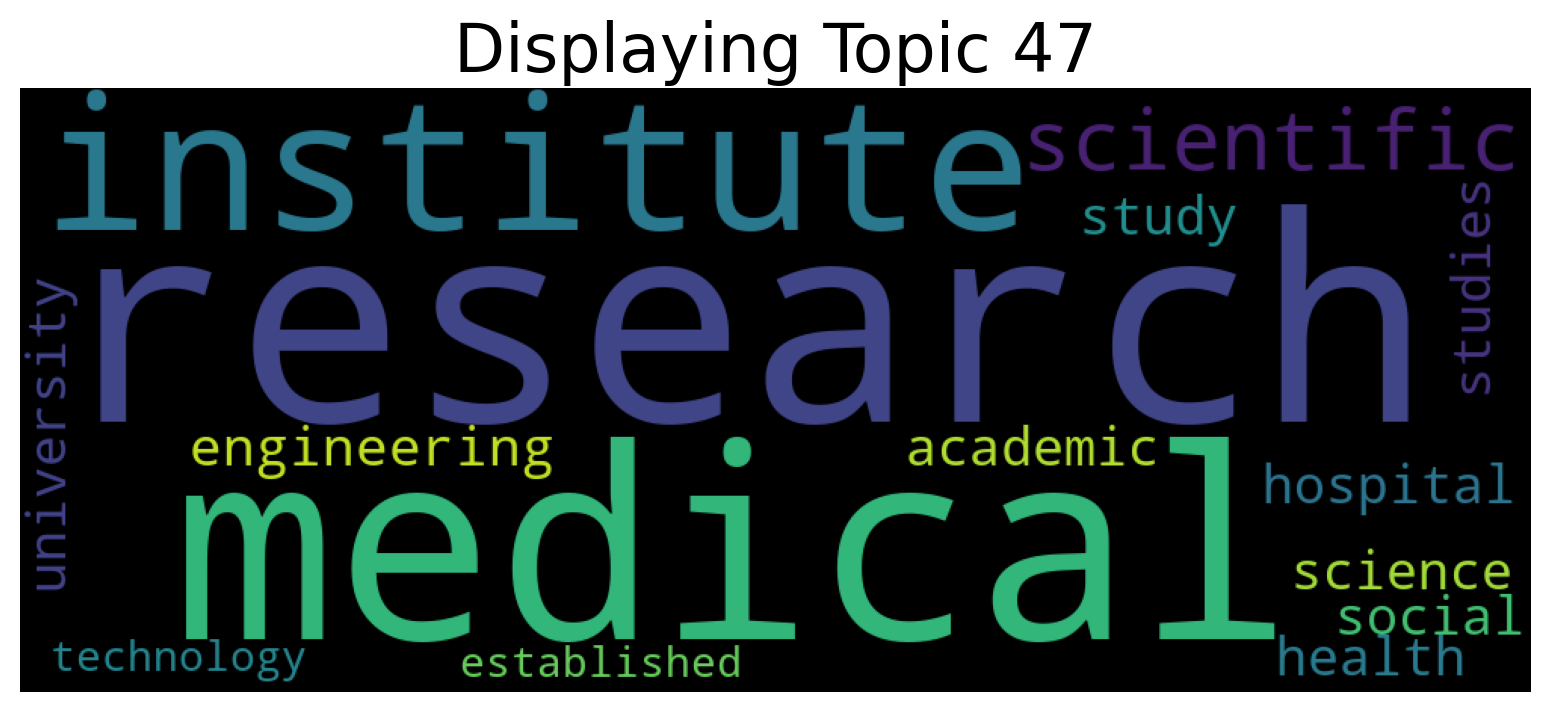
Showing The Topic Word Cloud
You can also create a word cloud of the topic!
ctm.get_wordcloud(topic_id=47, n_words=15)